

How understanding the corporate lifecycle can offer valuable investment insights
Key Points
Our preferences, mindset, and energy are shaped by the stage we are at in life, driven by underlying characteristics tied to age, experience, and development. It seems natural that a teenager would have a vastly different perspective to someone in their late 40s — the same can also be said of the corporate world.
Companies, as well as people, pass through recognisable lifecycle stages — from scrappy, loss-making upstarts to high-growth disruptors, mature cash-generators, and eventually, in some cases, declining legacy players. Each stage comes with its own set of fundamentals, risks, and opportunities. The key difference? Unlike humans, companies can reinvent themselves. They can prolong youth, reverse decline, or stagnate unexpectedly.
Understanding what stage a company is at in its lifecycle can be very useful in making investment decisions. Quantitative analysis seeks to model behaviour that is both structured and widely observable — lifecycle stages offer exactly that, providing a rich seam of potential, actionable insights for investors.
We believe lifecycle-based classification can reveal meaningful patterns in company fundamentals and improve how we interpret risk, growth potential, and ultimately, returns. It can be a powerful lens to complement both fundamental and quantitative investing.
Lifecycle stages and characteristics
Traditional investment frameworks often overlook the importance of lifecycle dynamics. Most factor investing models evaluate companies based on size, value, growth or momentum – ignoring where a company stands in its natural evolution. For example, two firms with identical profit margins might be fundamentally different if one is scaling up while the other is in structural decline. Understanding where they are in their lifecycle can potentially highlight missing, different, or more nuanced information.
Below, we explain the stages of a company lifecycle, as well as the typical characteristics and profile of a company in each of these stages.
Companies in the Transitory stage are characterised by early experimentation with their product or business models, an unclear strategy and inconsistent revenues. Outcomes are highly uncertain, and these companies are typically very early-stage and not always profitable.
The Loss Maker stage includes companies that are consistently unprofitable and lack sustainable earnings. This situation may arise due to mismanagement, decline, or external shocks. Both early-stage startups and mature companies facing structural or operational issues can fall into this category.
Moving into Emerging Profitable Growth, companies have achieved profitability and experience rapid revenue growth with expanding margins. Their focus is on reinvestment, and they operate efficiently and with agility. These are generally young, fast-scaling companies showing strong operational momentum.
The Mature Growth stage features companies with an established market presence, stable revenues, and consistent cash flows. Despite their stability, they continue to reinvest significantly to support expansion. These are typically larger, well-positioned companies that are still experiencing growth.
In the Mature Stable stage, companies hold a strong market position with steady revenues and cash flows. Their primary focus shifts toward capital return strategies such as dividends and buybacks, prioritising shareholder value over aggressive growth.
Finally, the Decline stage involves companies facing shrinking revenues and margins, often losing their competitive edge. They tend to cut costs, sell assets, and reduce capital investment. Without reinvention, these companies risk obsolescence and long-term performance issues, often due to structural disruptions or outdated business models.
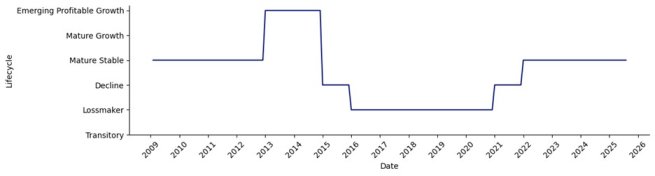
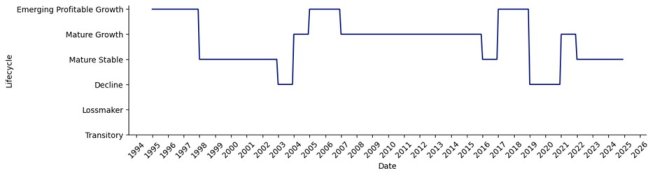
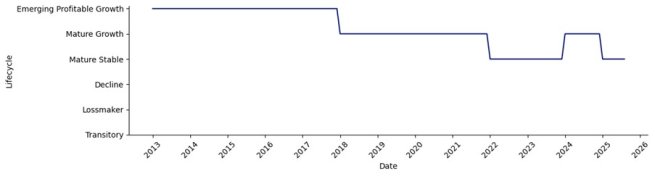
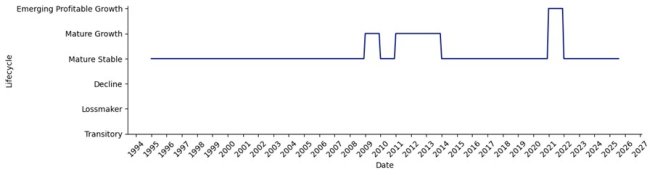
Companies are not bound to move linearly through lifecycle stages — they can reinvent themselves. It’s entirely possible for a firm in the Decline or Mature Stable stage to transition back into Emerging Profitable Growth. However, such a reversal typically requires meaningful innovation, a refreshed product line-up, and structural changes to reinvigorate a stagnating business model. We’ve observed several compelling examples of this kind of turnaround in practice; below is a series of charts showing how we classify the lifecycle stages of various large corporates over time, according to the framework above.
Valuable insights for investors
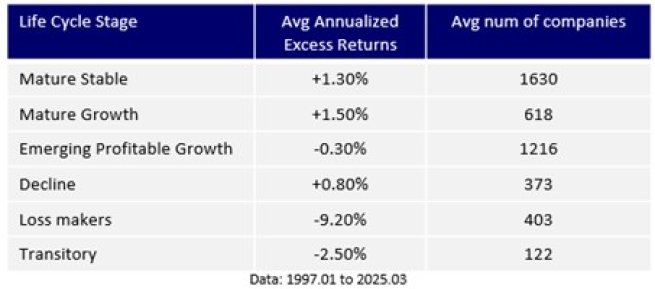
Figure 5 shows average annualised excess returns associated with companies in each lifecycle stage relative to companies in the investment universe (North America and Europe, Middle East and Africa developed stocks excluding microcaps).
Companies in the Mature Stable and Mature Growth stages exhibit similar return profiles, whereas those in Emerging Profitable Growth slightly underperform the overall universe. This table also indicates that exposure to the Mature Stable and Mature Growth segments can potentially offer allocation advantages.
Taking a factor-driven investment approach, we analyse the performance of the top quintile of each factor within each lifecycle stage relative to other companies in the same stage (see Figure 6).
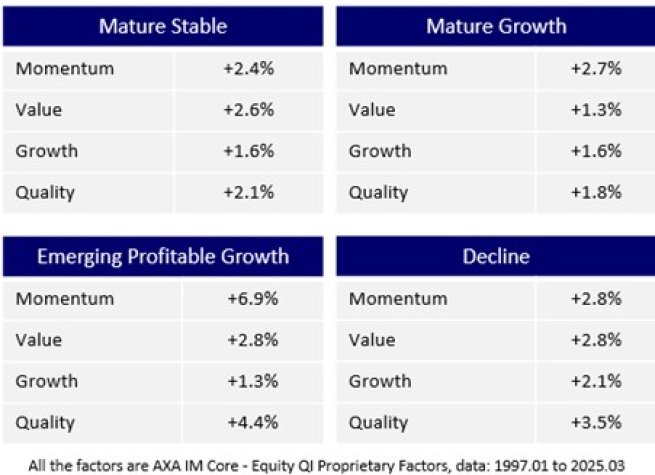
Our data indicates that stocks classed as Value - those which appear to be trading for less than their underlying worth - have seen the highest average excess returns among those in the Mature Stable stage of the lifecycle. However, Mature Growth companies have historically been more effectively selected based on momentum rather than quality.1
The Momentum and Quality factors – respectively stocks which have had a positive price change relative to the market over the last 12 months and those with more consistent earnings growth and typically less volatility - are particularly well-suited for selecting companies in the Declining and Emerging Profitable Growth stages. As seen earlier in Figure 5, the Emerging Profitable Growth segment exhibits slightly negative excess returns; however, through stock selection using Momentum and Quality factors, this segment has delivered the highest factor premia.
For these reasons, we believe that classifying companies according to their lifecycle stages offers valuable insights for investors. By understanding the unique characteristics and dynamics of each stage, investors can aim to enhance portfolio diversification, potentially improve risk management, and use these classifications as contextual frameworks in stock selection models.
1 Past performance does not guarantee future returns

Disclaimer
This document is for informational purposes only and does not constitute investment research or financial analysis relating to transactions in financial instruments as per MIF Directive (2014/65/EU), nor does it constitute on the part of AXA Investment Managers or its affiliated companies an offer to buy or sell any investments, products or services, and should not be considered as solicitation or investment, legal or tax advice, a recommendation for an investment strategy or a personalized recommendation to buy or sell securities.
Due to its simplification, this document is partial and opinions, estimates and forecasts herein are subjective and subject to change without notice. There is no guarantee forecasts made will come to pass. Data, figures, declarations, analysis, predictions and other information in this document is provided based on our state of knowledge at the time of creation of this document. Whilst every care is taken, no representation or warranty (including liability towards third parties), express or implied, is made as to the accuracy, reliability or completeness of the information contained herein. Reliance upon information in this material is at the sole discretion of the recipient. This material does not contain sufficient information to support an investment decision.
Issued in the UK by AXA Investment Managers UK Limited, which is authorised and regulated by the Financial Conduct Authority in the UK. Registered in England and Wales, No: 01431068. Registered Office: 22 Bishopsgate, London, EC2N 4BQ.
In other jurisdictions, this document is issued by AXA Investment Managers SA’s affiliates in those countries.
© 2025 AXA Investment Managers. All rights reserved
Image Source: Getty Images
AXA IM and BNPP AM are progressively merging and streamlining our legal entities to create a unified structure
AXA Investment Managers joined BNP Paribas Group in July 2025. Following the merger of AXA Investment Managers Paris and BNP PARIBAS ASSET MANAGEMENT Europe and their respective holding companies on December 31, 2025, the combined company now operates under the BNP PARIBAS ASSET MANAGEMENT Europe name.