

Up, down, turn around…
Markets are back to where they were before 2 April. Economists thought a recession was a sure bet but are not so convinced now. Investor sentiment – or at least market momentum – has been very positive. The thing is, we don’t know quite how the macroeconomic outlook has changed. It is surely worse in terms of growth and inflation, at least for a while. But US equity markets are back to their valuation highs. It’s that time of year that evokes the old saying “sell in May and go away”. Or at least tilt towards credit.
Is it a binary world?
On a simple level, the market volatility of the last six weeks can be explained by the rapid changes in the probability of a US recession. The sell trigger and the buy trigger both came from the lips or the Truth Social account of US President Donald Trump. It looked like a recession was nailed on when he unveiled the Commerce Department’s allegedly algorithmically generated reciprocal tariff rates and then doubled down - or more in the case of Chinese imports. Equity markets fell and the world quickly thought about disinvesting from an America that was ruining the global trade system. Risk-off looked like the correct strategy with many equity markets falling by more than 10%.
Then on 9 April, the Trump put was executed. He announced a suspension of most of those new tariffs and markets rallied hard. Recession risks were cut. Since then, the Administration has rolled further back on its hardline stance and fewer people are now forecasting a growth slump than was the case four weeks ago (which tells us something about the business of forecasting). It has been risk on. Stock markets are up between 10% and 30% since the low on 8 April. The same round trip has been seen in credit markets, with the widening of spreads in the ‘recession week’ totally reversing since. The markets didn’t like Trump’s so-called Liberation Day, and the President didn’t like the market’s reaction, so he folded, and now we are back to where we started.
Fear or greed
Investors will have had differing experiences during the last six weeks. Those who did nothing will have done fine. The MSCI World equity index is up 4% year-to-date while European stock indices are up by between 10% and 20%. Global credit indices are up close to 4.0%. However, if investors took the rational decision to reduce equity weightings and, specifically, reduce US exposure, the results will have been mixed given the voracity of the equity market rally since 9 April. The market timers will have done best if they were able to sell on the tariffs and buy on the pause. Being closely tuned into the particular modus operandi of the Trump Administration will have helped.
Tariffs up, growth down
I’m not sure that I have seen such swings in sentiment amongst market participants and economists. As I write, stock indices are above the levels they closed at the night before Liberation Day. US growth stocks have done best (the S&P 500 Information Technology sector is up 13% since 1 April), followed by global ‘trade’ bets like Mexico, Japan, India and Germany. Broader US indices, greater China equities, and the UK have shown only modest gains on a net basis through the tariff pantomime. But I can’t be alone in thinking the global growth outlook is worse now than it was at the beginning of the year. Based on what we know today, tariffs are going to be historically high. This will impact trade flows, supply chain dynamics and business planning. American companies relying on imported consumer goods for resale or industrial inputs will be paying higher prices and still might not have the certainty they require to plan output and investment, or the ability to maintain profit margins. China might be celebrating a ‘win’ over the US, now that Trump has taken down tariffs, but they are still going to be high. This will affect Chinese exporters’ volumes with potential negative implications for employment and output, not to mention raising US consumer prices.
In our macro, valuation, sentiment and technical framework for assessing asset return prospects, the macro outlook is worse than it was. The only meaningful factor that has improved is sentiment, driven by announcements of “trillions of dollars” of deals done by Trump. Sentiment is fickle though. It could turn sour when the reality of weakening economic data becomes evident.
Euphoric golden age pricing
Valuations are back to where they were. They are not attractive. The S&P 500’s 12-month forward price-to-earnings (P/E) ratio is 20.4 times - relative to the last 10 years, it is at the 76th percentile of the distribution. The German DAX index is up to the 90th percentile of the distribution of its P/E ratio. Broader European and UK indices are more reasonably valued being at around their average multiple and, in absolute terms, some five to 10 points lower than US indices. Cheap markets in this framework include Brazil, Mexico and UK small cap.
US equities are very expensive again. With the S&P 500 at more than 20 times earnings, its earnings yield is 5% compared to a 10-year Treasury yield of 4.4%. The equivalent earnings yield gap in the UK is 3.6% and in France it is 3.7%. The consensus earnings forecast for the S&P 500 is $260 per share for this year (10% up on 2024) and $296 and $335 for the next two years (more than 13% growth). There is an implied 13% compound annual growth rate for earnings since 2020. The historical growth rate since 1995 has been 7.4%. Those with sympathy for the MAGA ambitions and methods could believe US exceptionalism will continue to deliver high returns, with strong capital inflows representing a willingness to hold and increase dollar holdings amongst investors in the rest of the world. Recent events might cast some doubts on those assumptions. Perhaps selling semiconductors and airliners to the Gulf will supercharge the US expansion for another few years.
Bonds are ok
In the bond world, yields are still attractive, especially in credit. Looking at where credit indices are compared to their 20-year history, yields are generally in the third quartile of their distribution, while spreads are in the second quartile. Credit spreads are modestly expensive, but yields are on the cheaper side of average given where we are in the monetary cycle. US and UK credit markets offer the most attractive yields and returns in both markets should benefit from central bank easing over the next year.
Between two and three
Bond investors will have some concern about inflation. But the news has been good recently. US consumer price inflation for April came in at 2.3% at the headline level and 2.8% for core. Lower energy prices have helped recently and there was no evidence of tariff pass-through to final prices yet (recent import and inventory data suggest that there was plenty of stockpiling by US businesses ahead of tariffs). It still looks like it will be difficult to get inflation to, or below, 2.0% with annual inflation rates seemingly stable at current levels in the US, Eurozone and the UK. There is also upside risk from the tariffs. Having some inflation-linked bond exposure alongside other higher yielding assets could be helpful to portfolios, capturing inflation accrual and some potential benefit from lower real rates as global monetary easing continues.
Value versus value creation
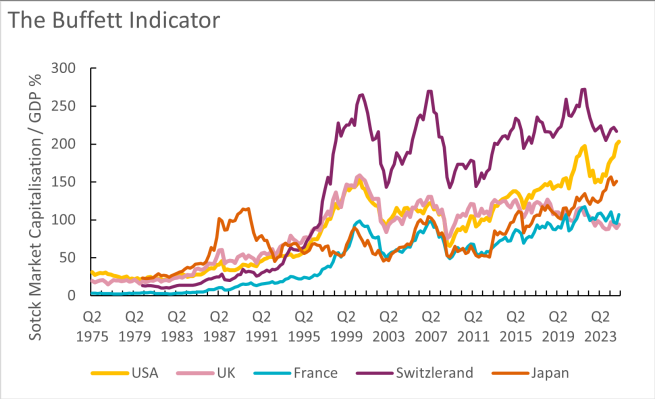
I think there is more uncertainty for investors and the global economy to face. To mark Warren Buffett’s retirement, I looked at one of the Berkshire Hathaway boss’s favourite indicators of stock market valuation - comparing market capitalisation to GDP. Using data from LSEG Workspace Datastream, the market cap of the US is around 200%. Comparable data for other countries puts Switzerland at 216%, and the UK and France at around 100%. But it’s the constant increase in the US measure that stands out. A decade ago, the US was about the same as the UK. Now it is twice as valuable relative to GDP. Since the global financial crisis, the ratio has gone one way, with a slight interruption to the trend during the pandemic.
Various policy puts from the US government and the Federal Reserve; the monetisation of fiscal expansion; and the rapid growth of the technology sector have created the exceptional rise in equity valuations, helped by the confidence that the rest of the world had in investing in the US. Now the market is very expensive, and perceptions might have changed. There has not been enough time since the tariff debacle for the real economic data to show whether any damage has occurred. Anecdotal evidence suggests there has been some. It might be time to “sell in May” just in case this does come through.
Final
Despite being in 16th position in the Premier League, Manchester United will contest the final of the Europa League next week (against Tottenham Hotspur, who sit in 17th position). Two teams that, optically, look like they were close to being relegated from England’s top division are, apparently, better than all the other European teams that entered the competition. I jest. In the senior European competition, the Champions League, there are no English clubs involved with Spain and Italy being represented instead. For United supporters, Wednesday offers the only chance of some glory at the end of an awful season. We have a knack of winning trophies. Ruben Amorim might follow in the footsteps of Louis van Gaal, Jose Mourinho and Erik ten Hag in winning some silverware despite failing to restore the domestic dominance achieved during the era of Sir Alex Ferguson’s leadership. One night in May…
Performance data/data sources: LSEG Workspace Datastream, ICE Data Services, Bloomberg, AXA IM, as of 15 May 2025, unless otherwise stated). Past performance should not be seen as a guide to future returns.


Disclaimer
This document is for informational purposes only and does not constitute investment research or financial analysis relating to transactions in financial instruments as per MIF Directive (2014/65/EU), nor does it constitute on the part of AXA Investment Managers or its affiliated companies an offer to buy or sell any investments, products or services, and should not be considered as solicitation or investment, legal or tax advice, a recommendation for an investment strategy or a personalized recommendation to buy or sell securities.
Due to its simplification, this document is partial and opinions, estimates and forecasts herein are subjective and subject to change without notice. There is no guarantee forecasts made will come to pass. Data, figures, declarations, analysis, predictions and other information in this document is provided based on our state of knowledge at the time of creation of this document. Whilst every care is taken, no representation or warranty (including liability towards third parties), express or implied, is made as to the accuracy, reliability or completeness of the information contained herein. Reliance upon information in this material is at the sole discretion of the recipient. This material does not contain sufficient information to support an investment decision.
Issued in the UK by AXA Investment Managers UK Limited, which is authorised and regulated by the Financial Conduct Authority in the UK. Registered in England and Wales, No: 01431068. Registered Office: 22 Bishopsgate, London, EC2N 4BQ.
Risk Warning
The value of investments, and the income from them, can fall as well as rise and investors may not get back the amount originally invested.
AXA IM and BNPP AM are progressively merging and streamlining our legal entities to create a unified structure
AXA Investment Managers joined BNP Paribas Group in July 2025. Following the merger of AXA Investment Managers Paris and BNP PARIBAS ASSET MANAGEMENT Europe and their respective holding companies on December 31, 2025, the combined company now operates under the BNP PARIBAS ASSET MANAGEMENT Europe name.