

Living in a nominal world
As Madonna almost said, we live in a nominal word. Economic transactions have been taking place at increasingly higher dollar levels. Nominal GDP growth has been stronger in the last two years than at any other time since the early 1970s. That means higher costs and prices, but also higher revenues and incomes. There are winners and losers. Many companies have been winners, with sales revenues extremely strong and pricing power allowing profit margins to rise. After the multiple adjustments in equity markets last year, the stability of bond yields since last October has allowed equity prices to benefit from the nominal effect on revenues and earnings. That may change and the macro narrative is negative. But given the step change higher in nominal GDP growth levels in the last two years, the downside for stocks might be surprisingly limited and short-lived. And there are clear positive long-term growth trends and plenty of money to invest. Another bull market this decade looks highly likely.
Last year’s story
Global stocks delivered negative returns in 2022 because global interest rates went up. Higher discount rates led to a significant contraction of equity multiples. The macro narrative was a cocktail of the inflation shock, ongoing disruptions because of COVID-19, uncertainty generated by aggressive central bank tightening and a worsening geopolitical backdrop marked by the Russian invasion of Ukraine and by the growing divisions between the US-led West, on one hand, and China, Russia, and the Emerging South on the other. These things remain in the macro narrative. Yet, global stock markets are up this year.
Equities up in 2023
Investors and commentators who heavily weight the macro view in their expectations of market behaviour have got it wrong in 2023 so far. Bond returns are positive and equity returns are healthy. The S&P 500 is up around 7.7% year to date in price terms and the total return from the MSCI World Index is 9.0%. What is going on? Real US GDP growth was just 1.1% in the first quarter (Q1), credit conditions are tightening, and there have been bank failures. According to surveys – and conversations I have with investors – there is not much positive sentiment towards equities. The outlook is one defined by forecasts of a US recession and slower corporate earnings growth.
Think nominal
I think to understand the performance of equities we need to think in nominal terms. My comments are limited to the US, but they hold for other markets too. Since Q1 2020, the US economy has expanded by 23% in nominal terms. In Q1 2023, annualised nominal GDP growth was 5.1% and year-over-year growth was 7.0%. For the last eight quarters, nominal growth has been above its long-term average. Of course, this is due to inflation. The difference between real GDP and nominal GDP growth since Q1 2020 has been a cumulative 16%. That is, of the 23% expansion in the current price value of economic activity in the US, 70% has been due to rising prices. Economic transactions of all kinds are taking place at a higher dollar value today than they were a year or two ago. But that means higher revenues and wages. For individual economic agents, revenues (income) do not necessarily rise at the same rate as costs (prices). There are winners and losers when inflation is higher.
Revenues up, margins higher
The significance of this for equities is clear. Sales growth, in current dollar terms, has been strong. Over the same period, for the S&P 500 universe of companies, revenue per share has increased by 25%. In an inflationary environment, companies of course face higher input costs and pressure for higher wages. At the same time, they can exploit pricing power. And they have. Profit margins have increased in the last three years. From the worst part of the pandemic, in Q3 2020, profit margins have risen from 9.2% to 12.05% in Q1 2023, according to Bloomberg estimates. They peaked at 14% in Q3 2021. Sales revenues have continued to rise. In the last year they are up 7.9%.
Rates versus earnings
The stabilisation of interest rate expectations and the significant decline in long-term yields since last October have allowed equity multiples to settle. You could argue that price-earnings (P/E) multiples are still too high in the US and that higher short-term interest rates have raised the barrier for equity returns. All true, but how long are short rates going to remain so high? What about future earnings growth? Comparing equity earnings yields against long-term interest rates does not give such a negative valuation picture. The point is that, until now, revenues and earnings have continued to grow because of inflation and that, in a period of interest rate stability, has pushed up equity prices.
Thanks Warren
There is something called the Buffett Indicator - the ratio of the market capitalisation of equities measured against GDP. There is a chart of this below, using a broad measure of the US equity market and nominal GDP. Currently it stands around 150%. The secular trend has been increasing as listed companies capture more of the value added in economic growth, and especially in the last decade or so because of stagnant real wages. In 2021 it reached 195%. The decline since then has been the result of rapid growth in nominal GDP (9.0% last year) and the multiple contractions in equities. The ratio is currently bang on the long-term trend. It is not suggesting stocks are cheap, but neither are they overvalued. Using the price-earnings ratio as another valuation yardstick, the market is slightly rich with the 12-month forward P/E ratio for the S&P at 18.4 times compared to a 25-year average of 15.9 times.
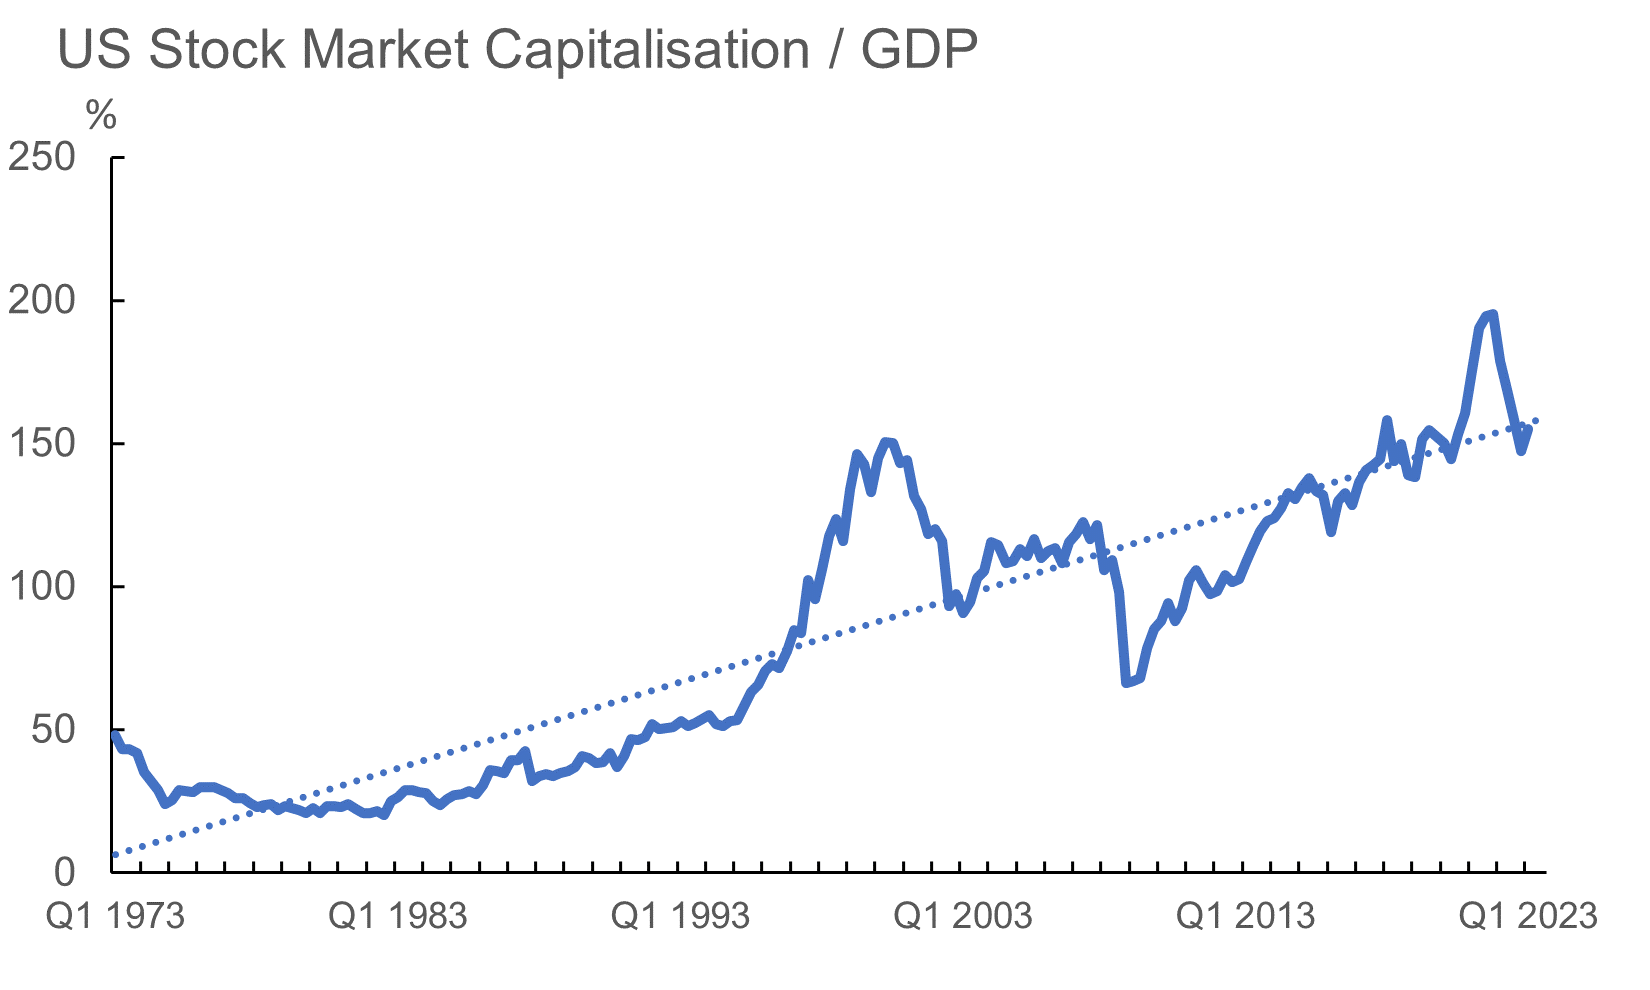
Source: Refinitiv Datastream, AXA IM, 28 April 2023
Slowing now
Long-term interest rates have stabilised. This has been positive for equity valuations. Earnings growth is now slowing because margins are coming back down under the pressure of rising wages and pressures on revenue growth in sectors like energy and banking, coming after the adjustment to growth in technology. For this earnings season, current estimates suggest earnings per share are going to be down around 4% compared to Q4 2022. Nominal GDP is also slowing. According to consensus forecasts, nominal growth will slow to around 5.0%-5.5% this year and 3.5% in 2024. That is quite a downshift from 2022’s 9.0%. It will be hard for sales growth to sustain the near 8% pace of the last year.
The recession narrative
Stocks tend to go down in a recession. Typically, by the time the Federal Reserve (Fed) cuts rates the economy is already in recession and equities tend to underperform bonds. This may be the road ahead with the market still pricing in interest rate cuts from the end of this year. Forecasts are for 4% earnings growth for the S&P 500 over the next year. This is not as weak as in previous recessions, but it may reflect the lingering nominal effect (the implication being that sales revenue growth will remain positive and margins will not contract that much, especially if the prognosis is a softish landing). Yet there are reasons from a macro perspective to expect pressure on corporate earnings as economic growth slows. The 1.1% expansion in real GDP in Q1 suggests that we are within a whisker of a recession. Yet the continued strength in the labour market and in a number of other indicators suggests that a deep correction in the economy is not on the cards.
Long-term positive
I believe that US equities should benefit from a growth premium and that means a higher P/E ratio compared to other markets. There are secular trends that are extremely supportive, which I have mentioned before. President Joe Biden’s administration’s legislative programmes to boost investment in the energy and technology sectors are supportive. Shifts in global supply chains are leading to the near-shoring of manufacturing (Mexico is benefiting from that) and growth in use of artificial intelligence could boost productivity as well as investment in the computing infrastructure necessary to allow its broader application throughout the economy. If inflation settles and interest rates do not go up much further, the outlook can be positive. Nominal GDP will go up still and any adjustment in stock prices that takes the Buffett Indicator lower is likely to be a buying opportunity. There is a lot of dry powder sitting in money market funds so any combination of lower equity markets and the Fed pivoting (in the next 12 months or so) could pave the way for another favourable market.
And finally
Annoyingly, it looks as though Manchester City could* match United’s famous treble of the Premier League, FA Cup and Champions League. There is some way to go until that is realised and United have a chance to stop it when they take on City in the FA Cup final next month. Form is not very encouraging though. Maybe it will need to be Real Madrid in the Champions League semi-final (of course, they are my favourite Spanish team). Seriously though, unlimited funding and fairly laissez-faire FIFA financial guidelines can get you a long way (no prizes for detecting a hint of jealousy). Let’s see, United could** still end up with two trophies, qualification for next season’s Champions League and a major part of Sir Alex Ferguson’s legacy still intact.
*(hope not)
**(hope so)
Disclaimer
This document is for informational purposes only and does not constitute investment research or financial analysis relating to transactions in financial instruments as per MIF Directive (2014/65/EU), nor does it constitute on the part of AXA Investment Managers or its affiliated companies an offer to buy or sell any investments, products or services, and should not be considered as solicitation or investment, legal or tax advice, a recommendation for an investment strategy or a personalized recommendation to buy or sell securities.
Due to its simplification, this document is partial and opinions, estimates and forecasts herein are subjective and subject to change without notice. There is no guarantee forecasts made will come to pass. Data, figures, declarations, analysis, predictions and other information in this document is provided based on our state of knowledge at the time of creation of this document. Whilst every care is taken, no representation or warranty (including liability towards third parties), express or implied, is made as to the accuracy, reliability or completeness of the information contained herein. Reliance upon information in this material is at the sole discretion of the recipient. This material does not contain sufficient information to support an investment decision.
Issued in the UK by AXA Investment Managers UK Limited, which is authorised and regulated by the Financial Conduct Authority in the UK. Registered in England and Wales, No: 01431068. Registered Office: 22 Bishopsgate, London, EC2N 4BQ.
In other jurisdictions, this document is issued by AXA Investment Managers SA’s affiliates in those countries.
© 2023 AXA Investment Managers. All rights reserved
AXA IM and BNPP AM are progressively merging and streamlining our legal entities to create a unified structure
AXA Investment Managers joined BNP Paribas Group in July 2025. Following the merger of AXA Investment Managers Paris and BNP PARIBAS ASSET MANAGEMENT Europe and their respective holding companies on December 31, 2025, the combined company now operates under the BNP PARIBAS ASSET MANAGEMENT Europe name.